The Dashboard Has Three graph to help you gauge your health: Weight, Outlook, Calorie Differential.
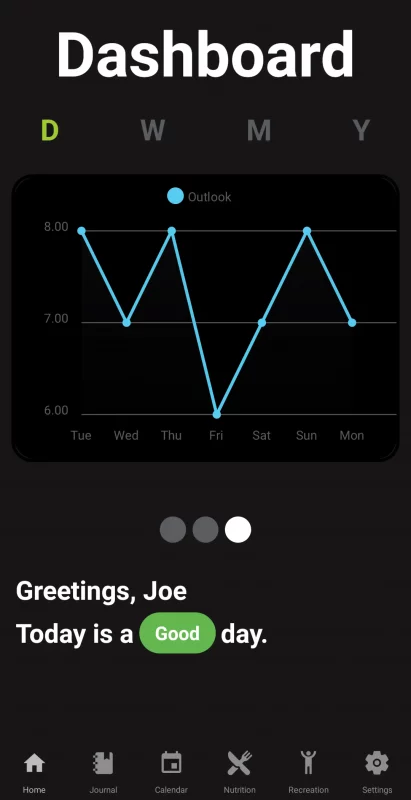
Outlook
Outlook shows you the trend of your mental state day to day based on you input of your Daily Journal entries.
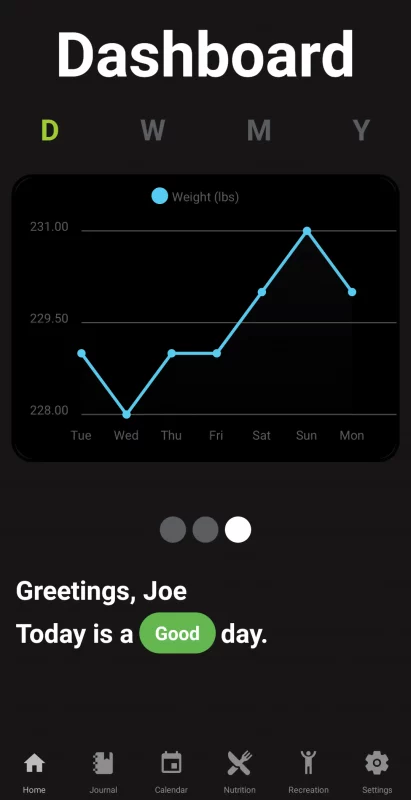
Weight
Weight shows you the trend of your physical state day to day based on you input of your Weight Log.
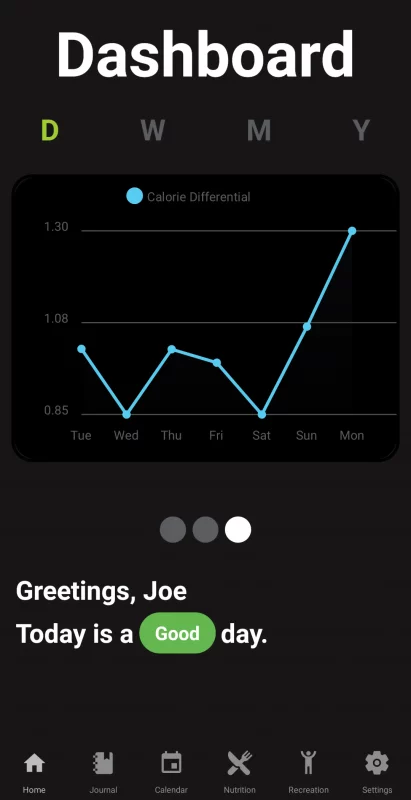
Calorie Differential
Calorie Differential shows you the trend of your Calorie intake day to day based on you input of your Cals In/out Entry.
Above 1.0 – You are consuming more calories than you are burning.
1.0 – You are eating and burning the same amount of calories.
Below 1.0 – You are burning more calories than your are consuming.